April 1, 2020
SFR REIT's & Unison: A Real Estate Super Investment
Home Co-Investments Can Boost Diversification and Principal Appreciation for Real Estate Investors
 Summary
- Rental yields are sticky, and low-yield markets remain so for long periods
- Single-Family Rental (SFR) REIT portfolios are concentrated in high-yield markets
- Operational efficiency necessitates clustered portfolios for SFR REITs, hindering diversification
- Home co-investments, free from the shackles of yield hurdles and operating margins, offer the opportunity to diversify freely
- Home co-investments offer superior diversification and operational simplicity compared to SFR
- For investors already owning SFR, adding home co-investments can improve diversification and boost capital appreciation Introduction
- Core Investments. The investor firmly believes that the property will produce stable rent and/or the property value (or rent) will rise substantially
- Value-add Investments. The investor seeks to improve the property in order to extract value from higher rents or sale prices.
Investors seeking exposure to residential real estate often ask why they should choose a home equity co-investment strategy over Single Family Rentals (SFR). In this article, we will break down the notion of the “one or the other” approach. We believe that a “both” approach offers the most comprehensive exposure to residential real estate — a $160+ trillion asset class and the largest component of GDP and CPI. Here we will compare the different incentives for the two strategies and show the difference in geographic exposure.
Rental Yield Investors: Exposure and Return Drivers
The primary focus as a traditional real estate investor is cashflow, specifically net rental yield. There are generally two types of investments:
Assuming a traditional (core) buy-and-hold approach, the question becomes, what locations offer the most attractive cash-on-cash yields?
For the purpose of this article, we assume our investable universe comprises the top 50 Metropolitan Statistical Areas (MSAs) based on population. Property value and rent data are from Zillow, and our market assumptions are as follows:
- Median purchase price and median rent for each MSA
- 5% vacancy and credit loss
- 65% operating margin (before management fee)
- 80% LTV
- 3.6% interest rate
- 30-year fixed rate mortgage
Note: Interest rates have decreased due to the Fed’s actions in response to the recession caused by COVID-19. Our analysis remains largely unchanged, as lower mortgage cost is offset by lower rents in urban markets and rising property value in suburban markets. We explored COVID-19’s impact on home price appreciation in urban vs suburban markets in a previous post. The map below (Figure 1) shows the MSAs with positive rental yields in blue, and ones with negative yields in peach. The size and color of the bubbles correspond to rental yield.
Figure 1: Top 50 MSAs Estimated Cash-on-Cash Yield [1]
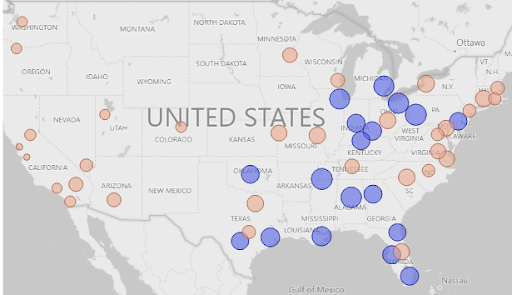
Out of the 50 metros, 18 have positive yields, and 12 of the 18 yield under 3%. For low-price properties, these yields translate to less than $100 per month cash flow, leaving little room for unexpected costs. The remaining six metros are Pittsburgh, Memphis, Birmingham, Cleveland, Detroit, and Chicago, with yields ranging from 3.3% to 4.5%. Conversely, San Jose and San Francisco have the lowest rental yields. New landlords there can expect “returns” of -11.3% and -11.0%, respectively. Figure 2 shows the 50 metros ranked by yield. Over the last five years (Figure 3), median yield for the top 50 MSAs decreased from -0.3% to -0.9%. This would indicate that the yield profile of rental properties have become less attractive. However, investors would have fared differently, depending on their entry points. The most opportune time to become a landlord was August 2016, when the median MSA cash-on-cash yield was 2.4%. The worst time to do so was November 2018, when the median MSA yielded -4.1%.
Figure 2: Top 50 MSAs Estimated Rental Yield (Descending Order)
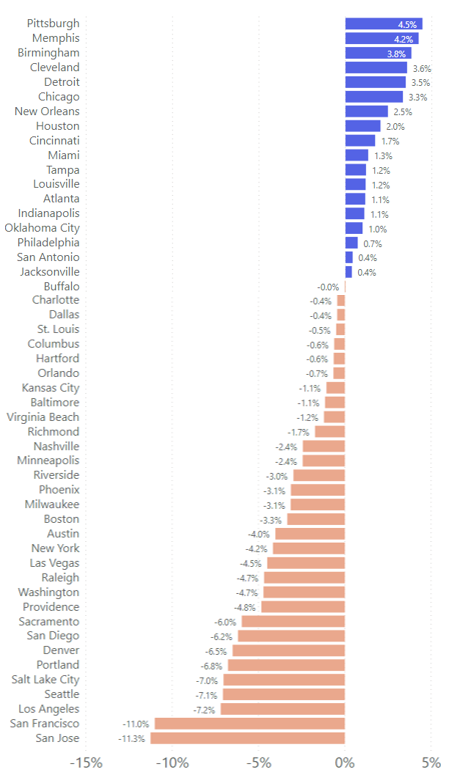
Figure 3: Top 50 MSA Estimated Cash-on-Cash Yield (2014-2019)
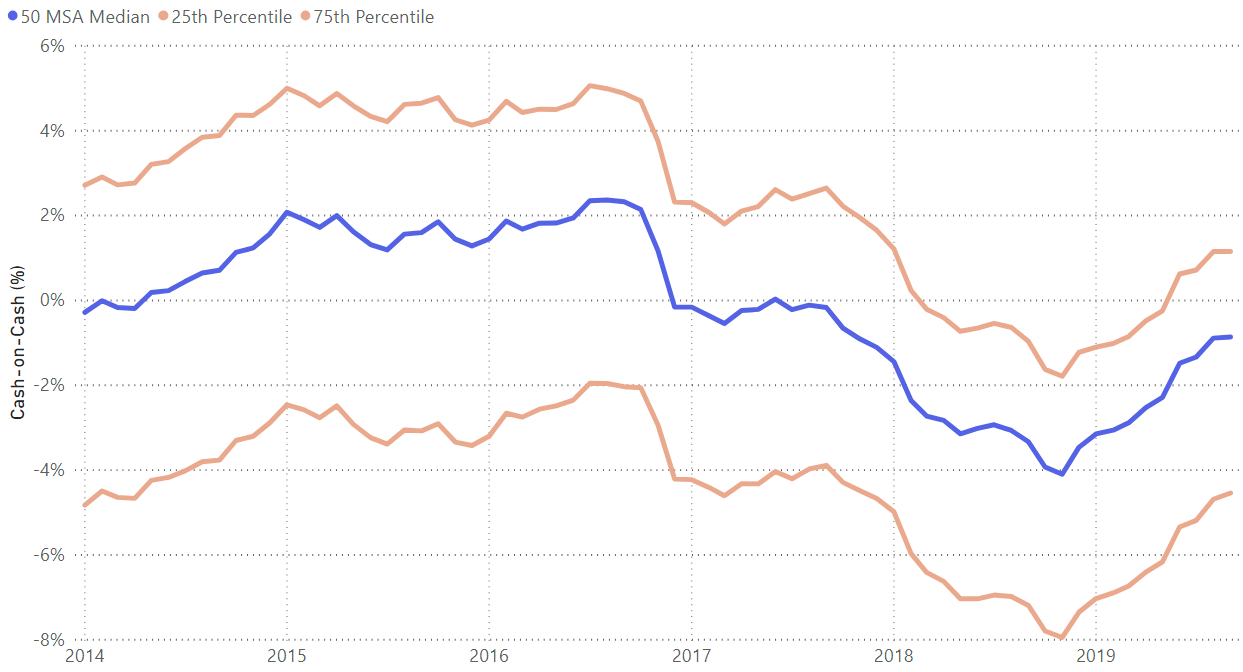
One thing to note from the above chart is that 92% of the MSAs in the lowest yield quartile at the beginning of 2014 remained in the bottom quartile as of September 2019. We chose 2014 as the start date to coincide with the public listing of American Homes 4 Rent - the second largest SFR REIT. Conversely, 77% of the MSAs that were in the top quartile at the beginning of 2014 remained so in September 2019. This persistence suggests a structural difference between MSAs located in the top quartile and those in the bottom quartile. Yields are sticky, and cities with prohibitively low yields tend to remain so. This suggests that if investors were to invest on the premise of rental yields, they could be precluded from realizing geographic diversification over extended periods of time, as much of the market, especially in areas where land is scarce (downtown, near public transportation/shops/jobs), has negative rental yields. Las Vegas, a market that we highlighted in Resilient and Vulnerable Cities: A Guide to Residential Real Estate Investing, is one exception to the yield persistence. Due to the city’s heavy reliance on discretionary goods and services, its housing market is subject to amplified boom and bust cycles that exacerbate macroeconomic trends. In the wake of COVID-19, once foreclosure subsidies wane, Las Vegas is likely to swing from a HPA market into a high-yield rental market. Single-family operator American Homes 4 Rent (AMH) is already seen frontrunning the potential rise in yields with their build-to-rent program in the Spring Valley suburb of Las Vegas.
Home Co-Investments Provide Diversification with Different Return Drivers
A home co-investment is a bet on the price appreciation of home, often via structurally-levered assets such as options contracts. Home co-investors focus their underwriting on property appreciation, which differs fundamentally from traditional yield real estate investors, who focus on rental yield. Drivers
As shown previously, areas with low rental yields tend to deter yield-centric investors, and it is no accident that these same areas have achieved the highest home price appreciation. Despite obvious diversification benefits, low-yield-high-HPA areas remain out of reach for institutional investors due to the many costs of carry - taxes, CapEx, property management, maintenance, and mortgage. In contrast, cost of carry is a non-issue for home co-investors — since homeowners bear all the costs associated with property ownership and upkeep. Consequently, home co-investments allow investors to build more diversified portfolios without yield and operation constraints.
Comparing SFR vs Co-Investments
When examining SFR REIT exposure to the top 50 MSAs, one would expect their portfolios to be highly concentrated in high-yield MSAs. After researching the portfolios of the two largest public SFR REITs - American Homes 4 Rent and Invitation Homes (INVH) - this dynamic largely holds true. Roughly 30% of AMH’s portfolio by unit count is in positive-yielding MSAs, while INVH has 45% of their portfolio in those areas. If we were to include those MSAs that have cash-on-cash yields of -3% or higher, in which REITs could opportunistically enhance yields (via discounted purchases, value-add development), those numbers increase to 50% and 62%, respectively. Figure 4: Geographic Exposure by Investor[2] [3]
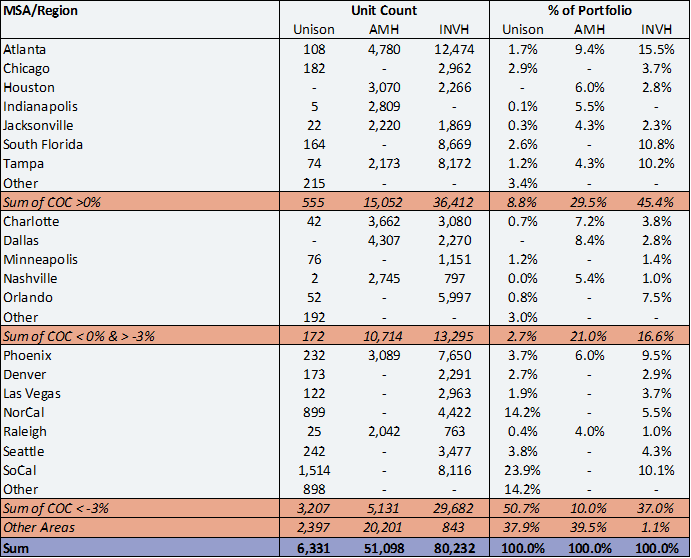
Relative to American Homes 4 Rent, Invitation Homes has a larger portion of their portfolio in currently negative-yielding areas. However, Invitation Homes began purchasing single family homes at scale in 2012, when a much larger selection of MSAs were yield-positive. It has also been reported that corporate buyers were regular attendees at foreclosure auctions[4], allowing the company to purchase homes at discounted prices. The opportunistic timing likely enabled Invitation Homes to gain exposure to negative-yield areas, but the strategy is no longer replicable. Furthermore, data shows that properties owned by SFR REITs in the negative yield MSAs are located in higher cap rate locations.
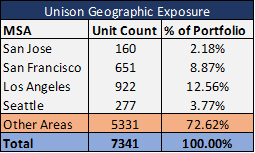
To illustrate the exposure contrast between SFR REITs and home co-investors, we look to Unison’s portfolio composition. As of Q1 2020, Unison’s exposure to the four lowest-yielding MSAs ——San Jose, San Francisco, Los Angeles, Seattle — stands at 27.4% (41.3% by value). These are some of the most vibrant cities with a world-class combination of transportation, entertainment, cultural, and employment amenities. But due to low yield, SFR investors have been locked out of these markets. REITs and home co-investors take very different paths to achieve total return. Using stocks as an analogy, rental homes offer high dividend yields, while home co-investments offer capital appreciation. We will examine the total return components in more detail in a future piece.
Figure 5: Example Co-Investor Portfolio[5]
Intra-MSA Exposure
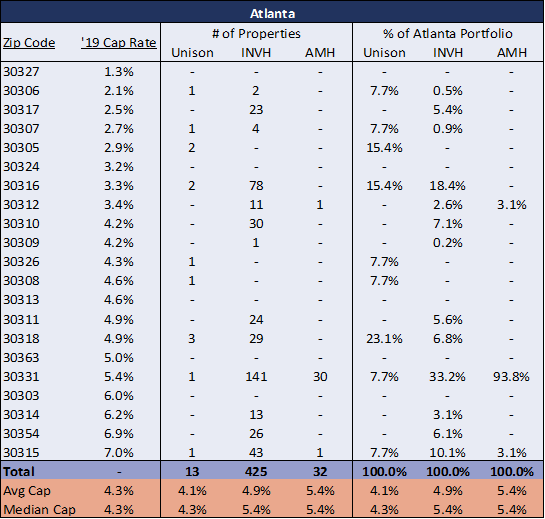
Understanding MSAs are not monoliths, it may be possible for both traditional investors and home co-investors to find investments that suit their objectives within the same MSA. To show how this takes place in practice, we rank zip codes by current cap rates in Atlanta - a city that has positive rental yields based on our calculations in Figure 1 - and examine the intra-MSA exposures between SFR and home co-investments. We used public record data[7] to proxy the portfolios of Invitation Homes and American Homes 4 Rent by identifying homes owned by known affiliates of the two REITs, as of December 2019.
Figures 6 shows that Unison had invested more heavily in lower cap rate areas than the SFR REITs. The average cap rate for zip codes with Unison investments is 4.1%, compared to 4.9% for INVH and 5.4% for AMH.
Figure 6: Atlanta Geographic Exposure by Investor[8]
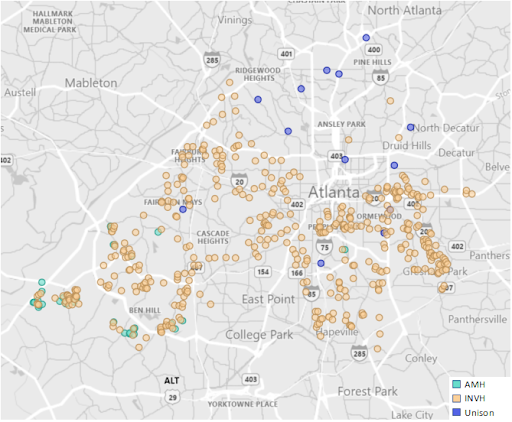
Graphically, the contrast in exposures is even more prominent (Figure 7). Unison has a bias for the region spanning from downtown Atlanta to Buckhead/North Atlanta, while the REITs have invested more heavily in East, South, and West Atlanta.
Figure 7: Atlanta Geographic Exposure by Investor (Mapped)[9]
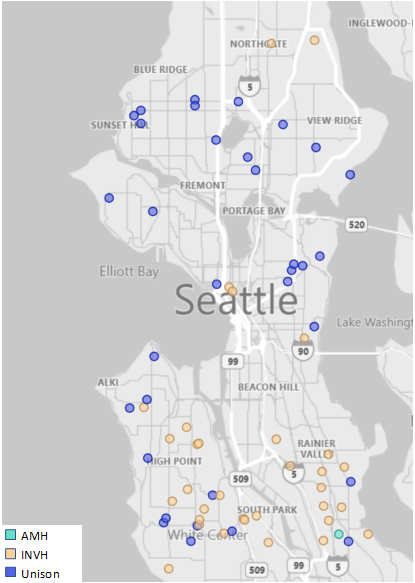
Another example to illustrate this point is Seattle, a city that has significantly different cap rates and yield characteristics from Atlanta. Seattle has negative yields for investors based on our calculations. Similar to Atlanta, the results show that Unison’s portfolio covers mostly the lower cap rate areas. The average cap rate for Unison is 2.0%, compared to 2.5% for INVH and 2.6% for AMH.
Figure 8: Seattle Geographic Exposure by Investor[10]
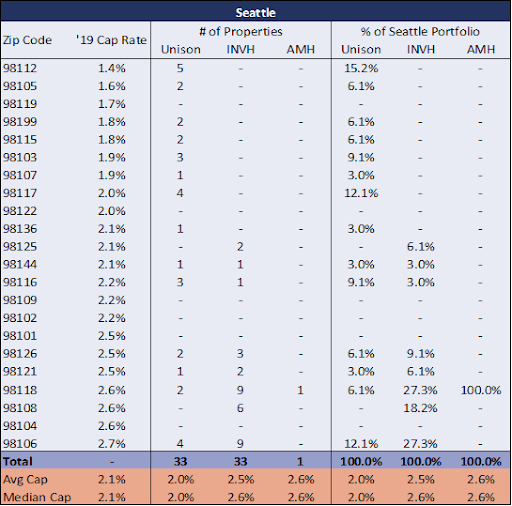
Again, we see a clear distinction between portfolio exposures. The SFR REITs are concentrated in South Seattle, while Unison is diversified across the city. As further evidence for the exposure dichotomy, the SFR REITs have zero exposure to zip codes under 2% cap rates.
Figure 09: Seattle Geographic Exposure by Investor (Mapped)
Concentration of Exposure
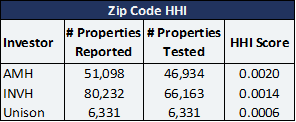
Rental investors have to operate and manage the properties. This operational burden necessitates the clustering of properties in order to drive efficiencies through centralized property management and maintenance. Buying properties too far from one another simply results in more driving time for maintenance staff and reduced negotiating leverage with vendors. To test this notion, we calculated the Herfindahl-Hirschman Index (HHI) for each of the SFR REITs and Unison[11]. Not surprisingly, the results show that Unison has the lowest HHI score[12] at the zip code level, indicating better diversification, despite being invested in far fewer properties.
Conclusion
Traditional real estate investors and home co-investors have very different objectives and contrasting geographic exposures. Rental real estate investors focus on yield to drive total return, while home co-investors focus on price appreciation. Home co-investors are able to construct more diversified portfolios without the burden of yield hurdles.
We showed that over time, low yield markets tend to remain so. From San Francisco, Washington D.C., to New York City, top metros with diverse economies also tend to be the lowest yielding rental markets. This phenomenon precludes rental operators from diversifying into these areas, resulting in biased portfolios akin to baskets of high yield stocks. This trend is prominent not only at the national level, but also holds true within cities, as SFR REITs consistently shun crown jewel neighborhoods where owning is preferred to renting. Operationally, given the burden of operating expenses, rental operators are compelled to concentrate their portfolios in clusters in order to scale efficiently. Combined with the high-yield tilt, SFR REITs essentially construct concentrated high-yield portfolios.
In contrast, home co-investments, unshackled by yield hurdles and cash flow margins, allow investors to diversify more freely. Firms like Unison can invest in high growth and high yield areas alike, achieving broader diversification for investors.
Home co-investments offer superior geographic diversification and operational simplicity for investors seeking comprehensive exposure to residential real estate. For investors who already own residential real estate, adding exposure to home co-investments can improve geographic diversification and balance their portfolios with more capital appreciation.
[1] Computations based on Zillow’s ZHVI All Homes values and Zillow Observed Rent Index (ZORI) Time Series: Multifamily, SFR, and Condo data as of September 2019. Assumptions are 20% down, 3.6% interest rate, 30 yr fixed rate mortgage, 5% vacancy & credit loss, and 65% NOI margin on the effective gross income.
[2] Information taken from INVH Q3 2019 10-Q, AMH Q3 2019 10-Q, CoreLogic, and Unison. INVH Q3 2019 10-Q notes "South Florida" includes Miami-Fort Lauderdale-West Palm Beach, FL, and Port St. Lucie, FL, "Northern California" includes Sacramento-Arden-Arcade-Roseville, CA, San Francisco-Oakland-Hayward, CA, Stockton-Lodi, CA, Vallejo-Fairfield, CA, and Yuba City, CA, "Southern California" includes Los Angeles-Long Beach-Anaheim, CA, Oxnard-Thousand Oaks-Ventura, CA, Riverside-San Bernardino-Ontario, CA, and San Diego-Carlsbad, CA, "Other Areas" includes those cities/regions that were undisclosed in the AMH Q3 2019 10-Q and areas outside of the top 50 MSAs for INVH and Unison. INVH Q3 2019 10-Q noted 4,686 properties in the Carolinas region. Estimated Charlotte and Raleigh property count based on data queried from CoreLogic for known subsidiaries. Other properties not allocated to Charlotte or Raleigh were attributed to "Other".
[3] Unison does not currently operate in Texas
[4] "Blackstone takes its single-family rental bet public as sector ...." 1 Feb. 2017, https://www.cnbc.com/2017/02/01/blackstone-takes-its-single-family-rental-bet-public-as-sector-soars.html. Accessed 4 Mar. 2020.
[5] Unison portfolio as of 5/31/2020
[6] Cap rate defined as median rent less 5% vacancy and credit loss adjustment, with 65% NOI margin, divided by median value of homes in the zip code. Rent and home price data for all zip codes from Zillow.
[6] Via CoreLogic
[8] INVH & AMH data taken from CoreLogic data in December 2019. Unison data is as of 09/30/2019. Zip codes were limited to those available through Zillow data for the city of Atlanta.
[9] INVH & AMH data taken from CoreLogic databases in December 2019. Unison data is as of 09/30/2019
[10] INVH & AMH data taken from CoreLogic databases in December 2019. Unison data as of 09/30/2019. Zip codes were limited to those available through Zillow data for the city of Seattle.
[11] INVH & AMH data taken from CoreLogic databases in December 2019. Unison data as of 09/30/2019.
[12] # Properties Reported” are the number of properties that AMH and INVH reported in their Q3 2019 10-Q. “# Properties Tested” includes all of the properties owned by known affiliates of AMH and INVH found in the CoreLogic database, used to conduct the HHI test.
Informational Purposes only: The Content is for informational purposes only, you should not construe any such information or other material as legal, tax, investment, financial, or other advice. Nothing contained in this blog post constitutes a solicitation, recommendation, endorsement, or offer by Unison or any third party service provider to buy or sell any securities or other financial instruments in this or in any other jurisdiction in which such solicitation or offer would be unlawful under the securities laws of such jurisdiction.Authors:
Sam Lin
Jonathan Schwerin
Contact UnisonIM
For more information, please contact:
Unison Investment Management
4 Embarcadero Center, Ste. 710, San Francisco, CA 94111
Real Estate Equity Exchange, Inc. Copyright 2023
or visit our Contact page


©2025 Unison Investment Management, LLC | 4 Embarcadero Center, Ste. 710, San Francisco, CA 94111 | 415-992-4200