September 18, 2019
The Shape of the Yield Curve and Home Price Returns
Brodie Gay and Scott Thompson
Looking at performance in recessions shows an analogous result to performance during yield curve inversions. Housing tends to be resilient. While home prices declined significantly during the global financial crisis, this was a historical outlier. Housing has rarely been at the epicenter of recessions and is anchored by people’s fundamental need for shelter.
[1] Slope is defined as the difference in yield between 10 Year versus 3 Month Treasuries. While the spread between many different points on the curve can be considered, the 10 Year versus 3 Month spread has historically proven the best in terms of its power to predict future recessions. See San Francisco Federal Reserve “Did the Yield Curve Flip? Will the Economy Dip?” https://www.frbsf.org/our-district/about/sf-fed-blog/did-yield-curve-flip-will-economy-dip/
Yield Curve Inversion is a Bad Omen for the Economy
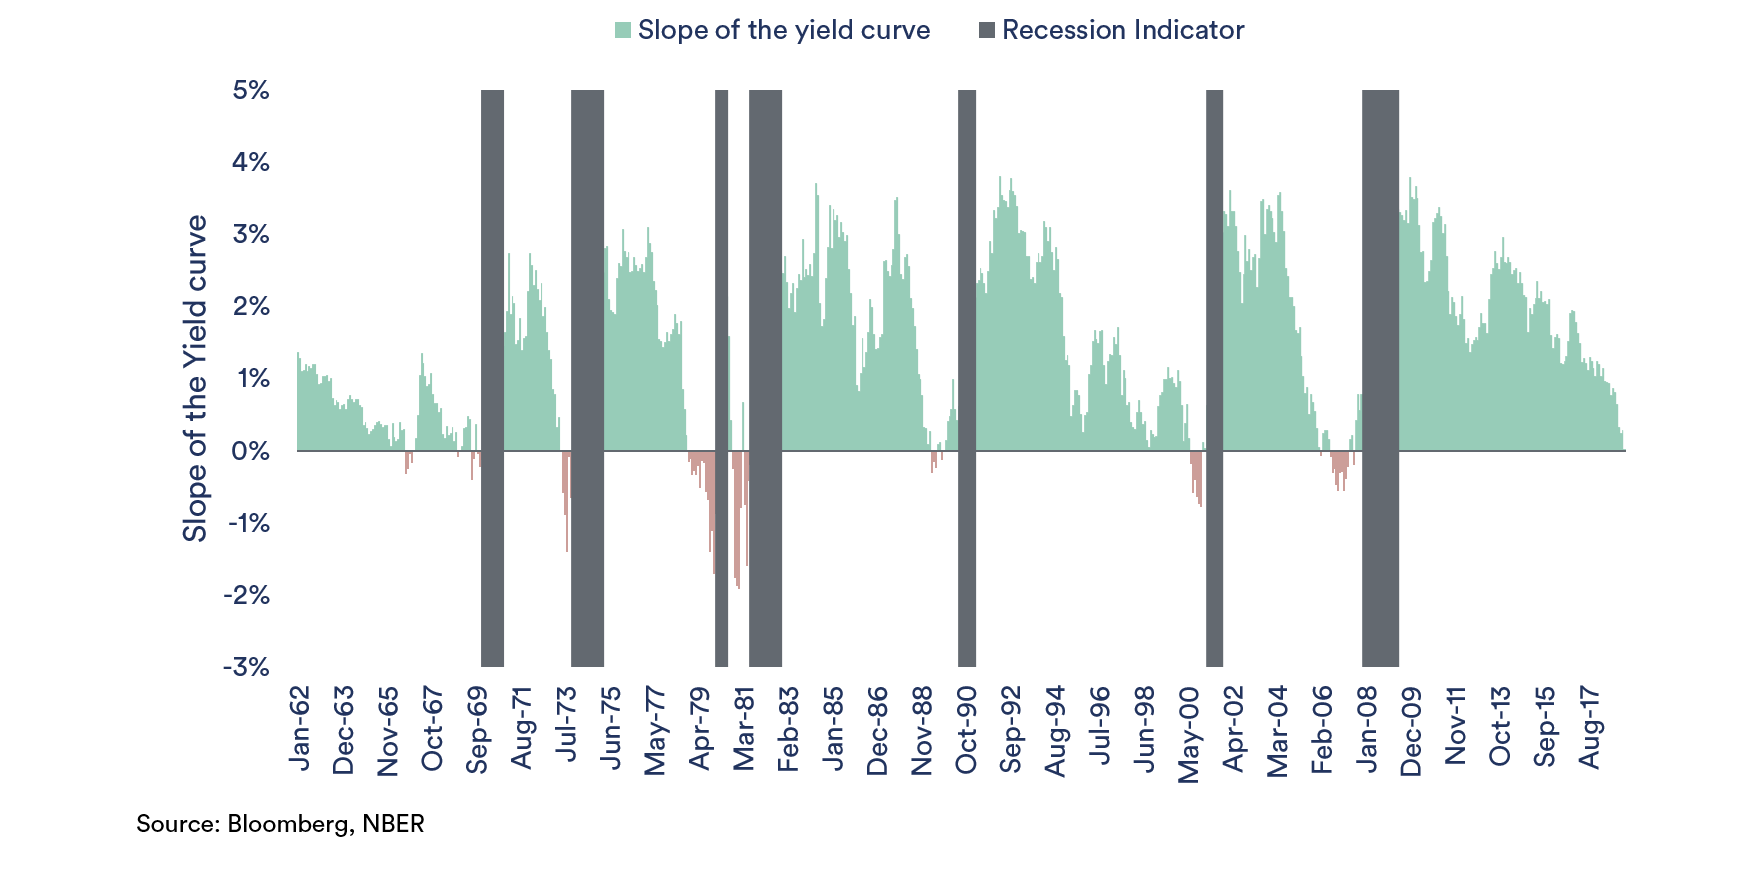
The shape of the yield curve is getting a lot of attention at the moment given that an inverted curve has preceded every US recession over the last 60 years. Beyond the ominous empirical track record, yield curve inversion is concerning for fundamental reasons. Long-term rates are guided by long-run expectations of the nominal growth rate (real growth plus inflation) of the US economy. When short-term interest rates exceed long-term rates, this suggests an investor would benefit from saving as opposed to investing in the economy. Increases in saving come at the cost of decreases in spending and investment, slowing economic growth.Figure 1: The slope[1] of the yield curve and recessions (1962 – 2018)
Homes and Stocks Behave Differently
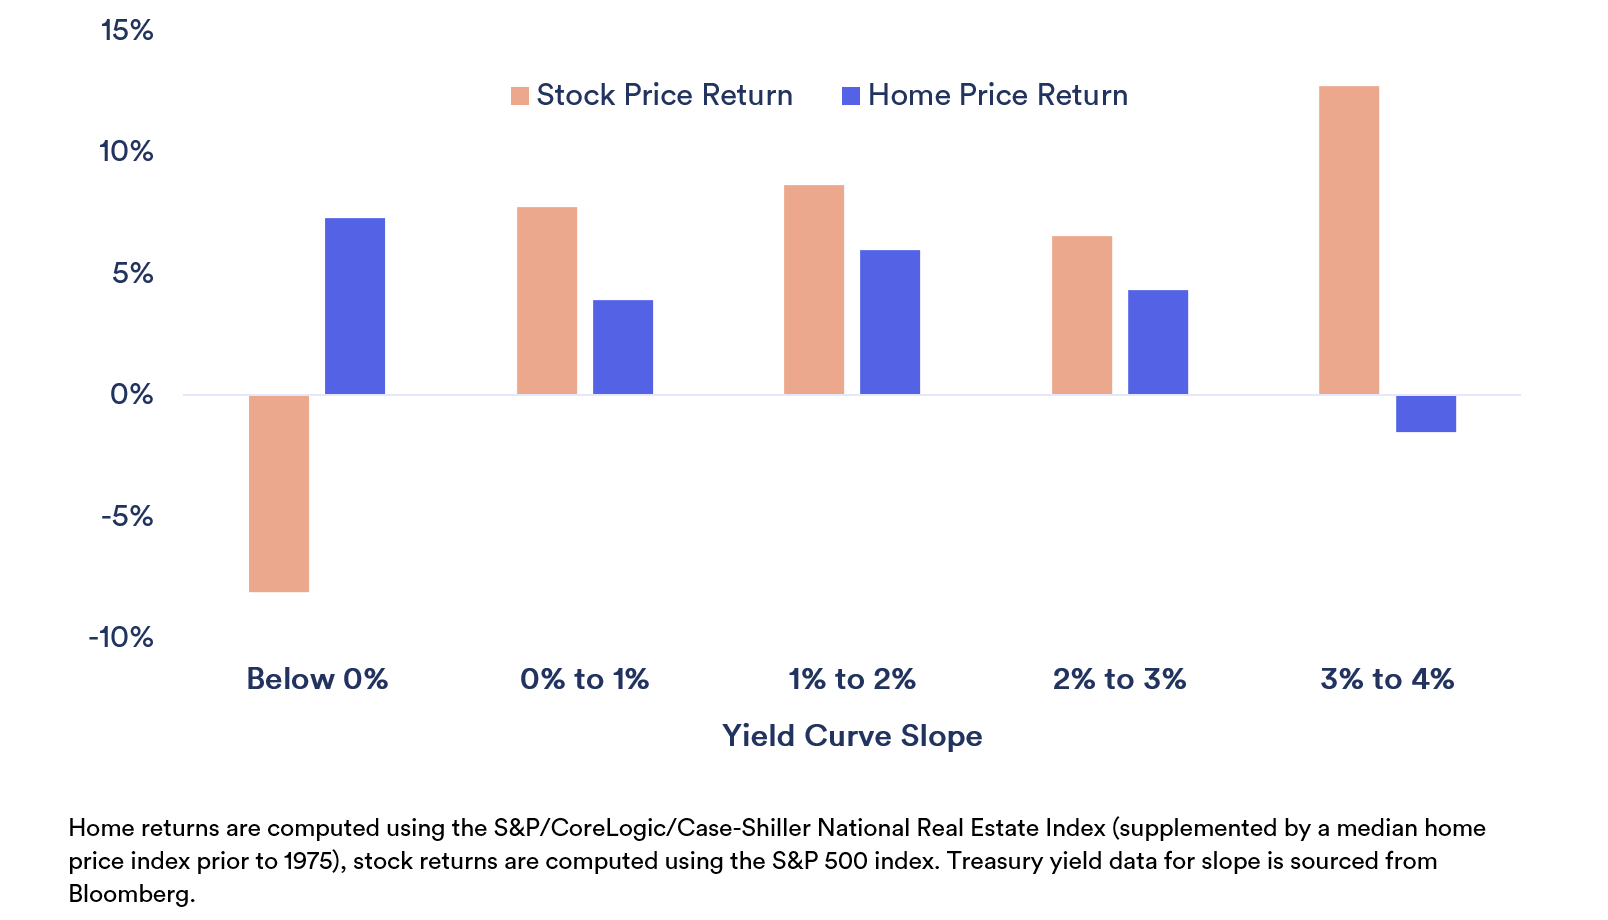
An inverted yield curve is a negative indicator for stock returns, prompting risk aversion among market participants. As shown in the chart below, stocks perform poorly in environments of inverted yield curves. Housing on the other hand has not demonstrated a statistically significant relationship between the slope of the yield curve and returns. If anything, housing has tended to outperform when the curve has been inverted.Figure 2: The relationship between average returns and the slope of the yield curve (1962 – 2018)
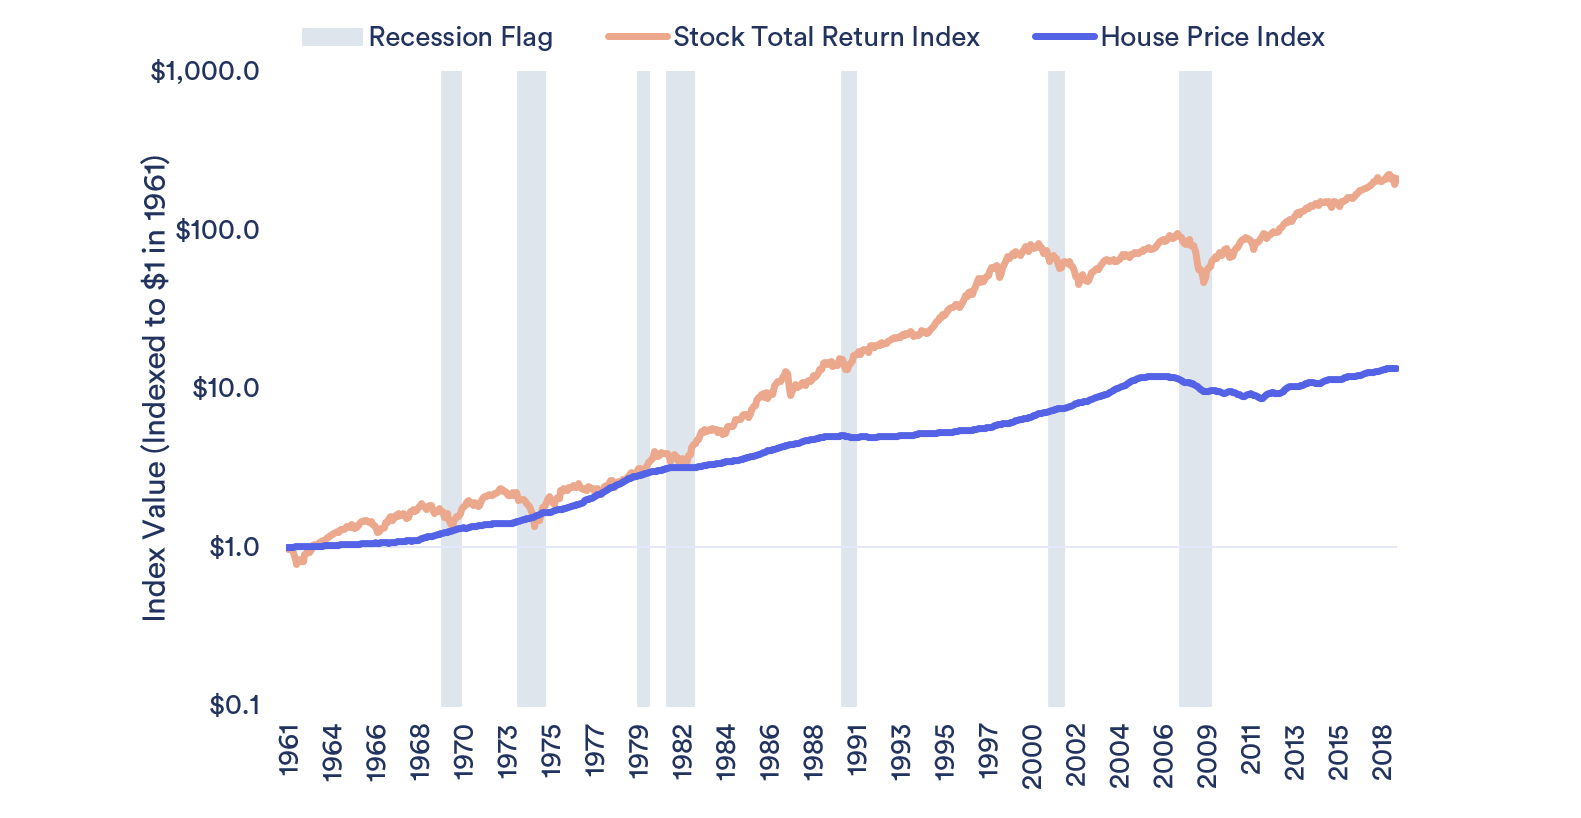
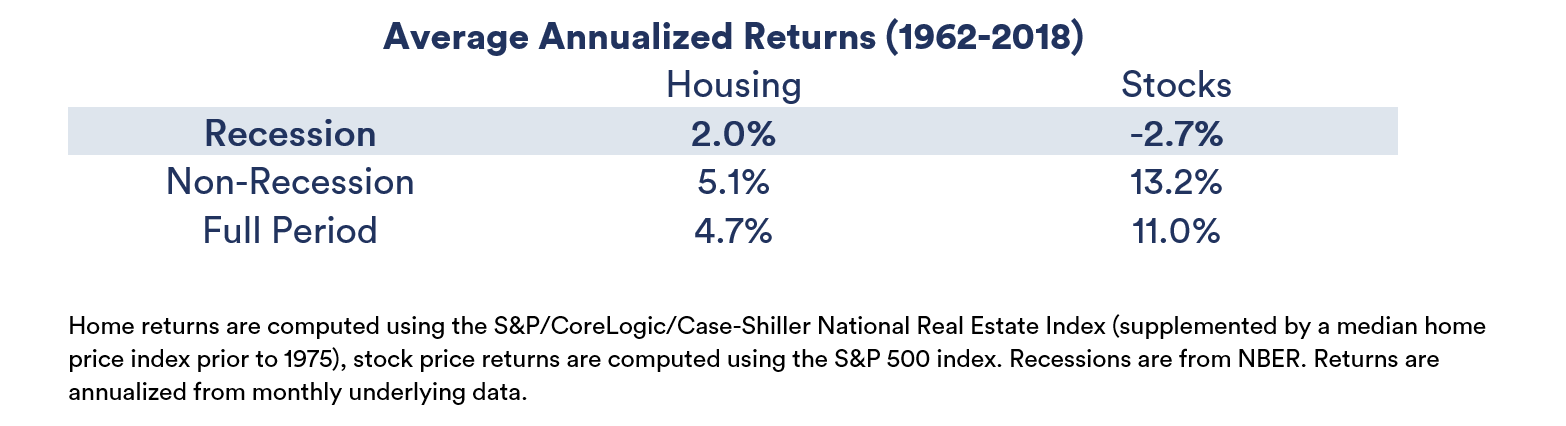
Looking at performance in recessions shows an analogous result to performance during yield curve inversions. Housing tends to be resilient. While home prices declined significantly during the global financial crisis, this was a historical outlier. Housing has rarely been at the epicenter of recessions and is anchored by people’s fundamental need for shelter.
Figure 3: Home and stock price indices perform differently during recessions
Final Thoughts
An inverted yield curve is a strong recession indicator and tends to coincide with weak stock market performance. Home prices on the other hand have tended to be resilient and a source of shelter for investors when the yield curve is inverted or the economy is in recession.[1] Slope is defined as the difference in yield between 10 Year versus 3 Month Treasuries. While the spread between many different points on the curve can be considered, the 10 Year versus 3 Month spread has historically proven the best in terms of its power to predict future recessions. See San Francisco Federal Reserve “Did the Yield Curve Flip? Will the Economy Dip?” https://www.frbsf.org/our-district/about/sf-fed-blog/did-yield-curve-flip-will-economy-dip/
Contact UnisonIM
For more information, please contact:
Unison Investment Management
650 California Street Suite 1800 San Francisco, CA 94108
Real Estate Equity Exchange, Inc. Copyright 2023
or visit our Contact page


650 California Street San Francisco, CA 94108 | 415-992-4200 | Real Estate Equity Exchange, Inc. Copyright 2023