March 8, 2017
Sunshine and residential real estate
I’ve been for a walk on a winter’s day.
I’d be safe and warm if I was in L.A.,
California dreamin’ on such a winter’s day.”
– The Mamas and The Papas
Earlier this year, Chicago’s stretch of 8 days without sunshine (January 21st to January 29th, 2017) made headlines as the cloudiest spell in over 25 years[1]. More so, for anyone who has had to dig their car out of snow – or worse yet, dig their car into a parking spot – the thought of moving to a place with more temperate weather is a constant temptation. Add to this the almost inevitable, lingering shadow of seasonal affective disorder – a DSM[2] recognized mood disorder believed to be related to the lack of sunlight – raises the question of how motivated people might be to leave for sunnier climes.
A more economically interesting question, however, is whether or not people are willing to pay to move to a place which is sunnier. Can a price be put on the pleasure of enjoying a mild winter’s day? To answer this question, we turned to residential real estate prices, as a measure of how much people were willing to pay to live in a sunnier location.
Figure 1: Counties in the contiguous states classified into deciles based on the average amount of sunshine received from 1979 – 2011. A list of large cities corresponding to each decile are shown on the left.
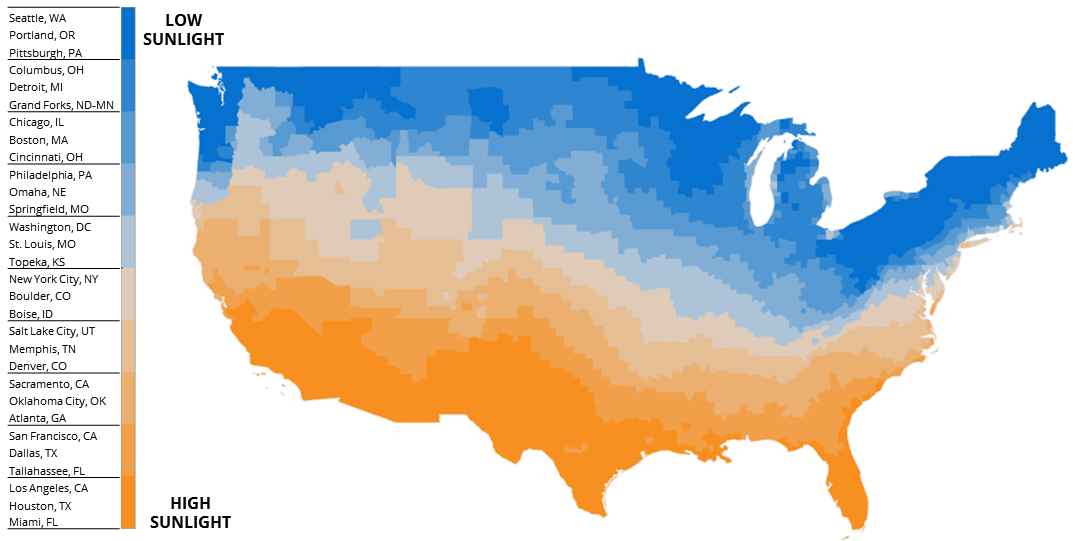
To understand which parts of the country receive more sunlight than others, we turned to the North America Land Data Assimilation System (NLDAS) Insolation Dataset. The term insolation, also known as solar irradiation, is a term for the intensity of solar radiation incident on the surface of the earth at a particular point and is measured in units of kilojoules per square meter. Insolation is dependent on two major factors – the season (insolation drops in winter due to the tilt of the earth’s axis) as well as the latitude of the location (the further north one goes, insolation drops due to projection of the incoming radiation from the sun). Insolation thus accounts for not only the number of sunny days but also the intensity of sunshine. It is further noteworthy that more than 70% of the incoming radiation can be blocked by the presence of clouds [3]. A map of counties in the United States tagged by the amount of sunshine received (Figure 1) tells a story of a country that is sunny and warm in the south and cloudy and cold in its north.
In order to investigate the performance of real estate based on the amount of sunshine received, we grouped counties into deciles and constructed Case-Shiller home price indices [4] for each of the deciles. The Case-Shiller home price index, which is a weighted repeat sales index, tracks changes in the prices of single family residences over time. The indices were calculated on a sample of 10 million sales pairs from 1996 to 2015 [5].
Figure 2: Average annual returns on investment by decile.
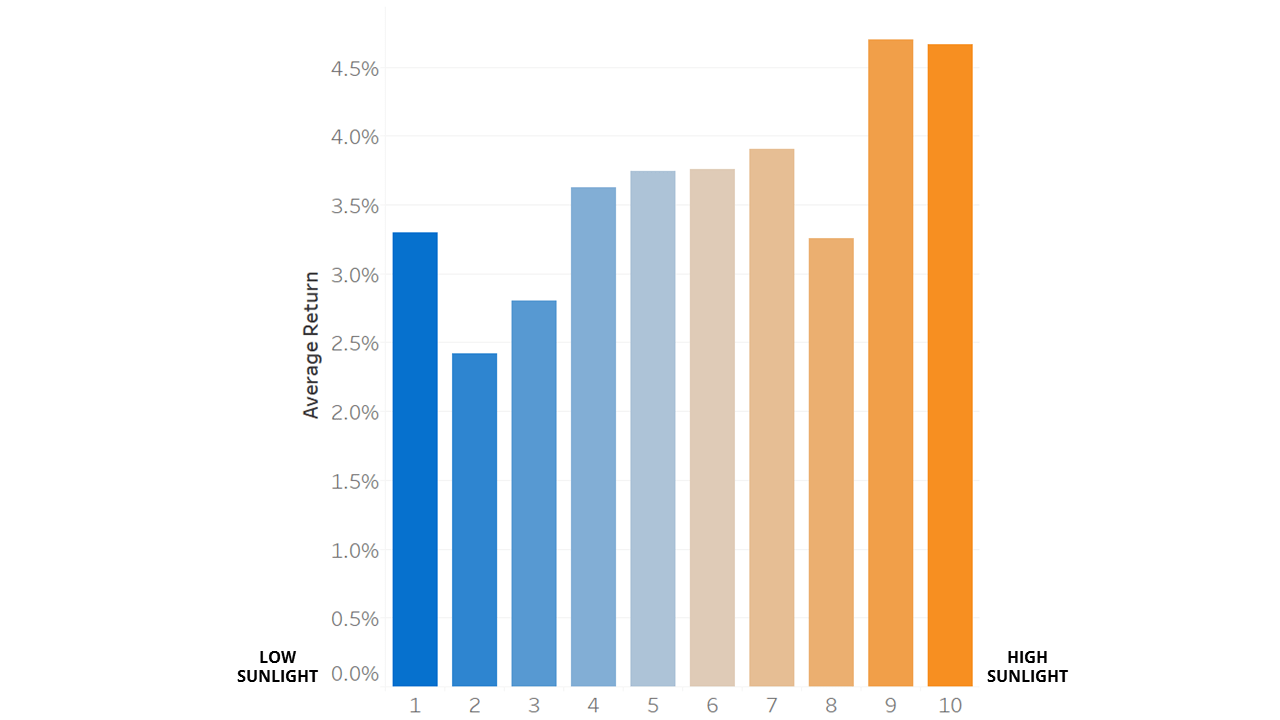
An inspection of the average returns on an investment from 1996 to 2015 shows a noticeable trend towards higher returns in sunnier counties (Figure 2). Texas, Florida, Arizona and California, are likely the strongest drivers of the high average returns seen in the top two deciles with Texas, California and Florida having the highest numeric growth in population since 1990 [6]. In addition to the aforementioned four states being home to 10 out of 15 of the country’s fastest growing cities [7], between 2015 and 2016 Florida, Arizona and Texas were amongst the top 10 fastest growing states on a percentage basis [6]. Additionally, between 1990 and 2015, California, Florida and Texas ranked 1st, 4th and 7th by percentage growth of immigrant populations [8]. In fact, more than 50% of the population growth in Texas’ can be attributed to foreign-born individuals [9], a process that is believed to stimulate the local economy due to the influx of working age populations, often with in demand skills [10].
On the other end of the spectrum, the cloudiest decile earned returns that were on par with the fourth through the sixth deciles. This likely a result of a renewed interest in living in the Pacific Northwest – namely the notoriously overcast cities of Seattle, WA and Portland, OR. Despite being known for having cloudy skies, the weather in Portland and Seattle are comparatively mild given their northerly latitudes, possibly due to the influence of warm ocean currents [10]. Between 2015 and 2016, Washington and Oregon ranked 4th and 9th for states with the highest numerical growth of population and 5th and 6th for states with the highest percentage growth [6]. The second and third deciles, that include much of the Rust Belt, are the worst performing deciles. The Midwestern cities of Chicago, Detroit and Cleveland are all amongst the large American cities that have shown negative growth since 1990, with Illinois having the largest numeric population loss of any state between 2015 and 2016 [6].
One of the major drivers of population growth in the sunny states is the growth of jobs. From 2008 to 2015, Texas, California and Florida ranked 3rd, 5th and 6th in percentage growth of jobs [12]. In addition to the availability of jobs, the fact that Texas and Florida do not have personal state income taxes, coupled with the relatively low cost of living, make them attractive destinations to move to. It should be noted, however that the returns are however not without their risks, as the two appear to have an almost linear relationship, when returns are plotted against systematic volatility (Figure 3). Growth areas with steeply increasing real estate prices driven by burgeoning demand, are also the regions that are most susceptible to demand drying up in times of economic downturn.
Figure 3: Plot of return vs systematic volatility with points labeled by decile.

All things considered, there appears to be a general trend of people paying more to live in areas with milder weather, though the effect of sunlight alone is confounded by other factors such as job prospects and local tax laws. Indeed, the effect of job growth in a region or the mobility of labor in general on home prices are topics worthy of their own research, since they are factors that almost certainly play a much more significant role than weather in the decision of individuals and families to move from one place to another.
Research References:
[1]http://wgntv.com/2017/01/29/chicago-has-gone-8-days-with-no-sun-the-cloudiest-spell-in-over-25-years/
[2]The Diagnostic and Statistical Manual of Mental Disorders published by the American Psychiatric Association, defines and classifies mental disorders
[3] “Effects of clouds on erythemal and total irradiance as derived from data of the Argentine Network”, Cede et. al., Geophysical Research Letters, 2002
[4] “Prices of Single Family Homes Since 1970: New Indexes for Four Cities”, Case and Shiller, New England Economic Review, 1987
[5] The sample size was chosen as a compromise between the accuracy of the results and the growth in computational time required to calculate the indices. Below is the visualization of 1 million sales-pair samples used to calculate the home price index.

[6] Calculated using data from The United States Census Bureau Population and Housing Estimates
[7] http://www.census.gov/newsroom/press-releases/2016/cb16-81.html
[8] The Migration Policy Institute
[9] “The Foreign-Born Population in Texas: Sources of Growth, Office of the State Demographer, Texas Demographic Center”, October, 2015
[10] “Is Migration Good for the Economy?”, Organization for Economic Co-operation and Development, May, 2014
[11] http://oceanservice.noaa.gov/education/kits/currents/05currents3.html
[12] “Which States Have the Most Job Growth Since the Recession?”, The Pew Charitable Trusts, May, 2015
Data References:
[1] North America Land Data Assimilation System (NLDAS) [https://wonder.cdc.gov/wonder/help/Insolation.html]
[2] United States Census Bureau [https://www.census.gov/programs-surveys/popest.html].
Contact UnisonIM
For more information, please contact:
Unison Investment Management
4 Embarcadero Center, Ste. 710, San Francisco, CA 94111
Real Estate Equity Exchange, Inc. Copyright 2023
or visit our Contact page


©2025 Unison Investment Management, LLC | 4 Embarcadero Center, Ste. 710, San Francisco, CA 94111 | 415-992-4200