May 30, 2017
Are your nest eggs all in one basket? Managing concentration risk in personal wealth
The Unison Solution – Vol. 1
Are your nest eggs all in one basket? Managing concentration risk in personal wealth
In this series of blog posts entitled “The Unison Solution,” we aim to provide objective analysis of the various use cases of the Unison program offering. In this inaugural post, we will explore the use of Unison HomeBuyer by a consumer who can afford a 20% down payment but chooses to use Unison to create a more diversified personal investment portfolio.The “optimal” investment portfolio for an individual will be dependent on a multitude of factors, such as the person’s age, salary, liquidity needs, specific financial goals, and risk tolerance. These unique, individual circumstances should dictate the asset allocation that will create an effective long-term plan for personal wealth management.
Modern Portfolio Theory teaches us that, for any given level of risk, there is an optimal mix of investment assets that will provide the highest return. However, the practical application of this for an individual can be difficult simply due to the inability to diversify. Moreover, the benefits of homeownership sought by an individual may result in an overallocation to a single, volatile asset.
As Brodie Gay articulated in his blog post “The Devil is in the details: risk and return in residential real estate,” the value of an individual home is far more volatile than what may be measured by the Case-Shiller index. Homeowners hold a portfolio far riskier than they may realize or desire and historically have had limited options to remedy the allocation.
Using Brodie’s findings regarding volatility and applying these concepts to individual case studies, we find that the use of a program such as Unison HomeBuyer can help reduce exposure to single-asset residential real estate and re-allocate wealth in a better-diversified portfolio that will result not only in a superior Sharpe ratio[1] but a more liquid portfolio to boot!
Establishing the “Base Case” scenario
To determine the financial impact of using the Unison proceeds to reinvest in other investments, we must first establish a model that simulates the expected cash flow from homeownership. I will refer to this as the Base Case scenario.For our baseline model, we will use the following assumptions that are based on national averages:
Home Purchase:
Purchase Price: $500,000
Mortgage Amount: $400,000 (80% LTV, 30-year fixed)
Down Payment: $100,000 (20%)
Purchase Transaction Costs: 2.0% of Home PriceHold Period Cashflow:
Interest Rate: 4.30%
Property Tax Rate: 1.35% of Purchase Price
Homeowner’s Insurance Rate: 0.35% of Purchase Price
Maintenance Cost: 1.0% of Purchase Price
Income Tax Rate: 25%
Inflation: 2%Home Sale:
Hold Period: 7 years
Home Price Appreciation (“HPA”): 3.4%
Sale Transaction Costs: 8.0%An outlay of these cash flows over the hold period of seven years will show the initial $100,000 investment withered down to $12,000 with an annualized IRR of -8.0%.
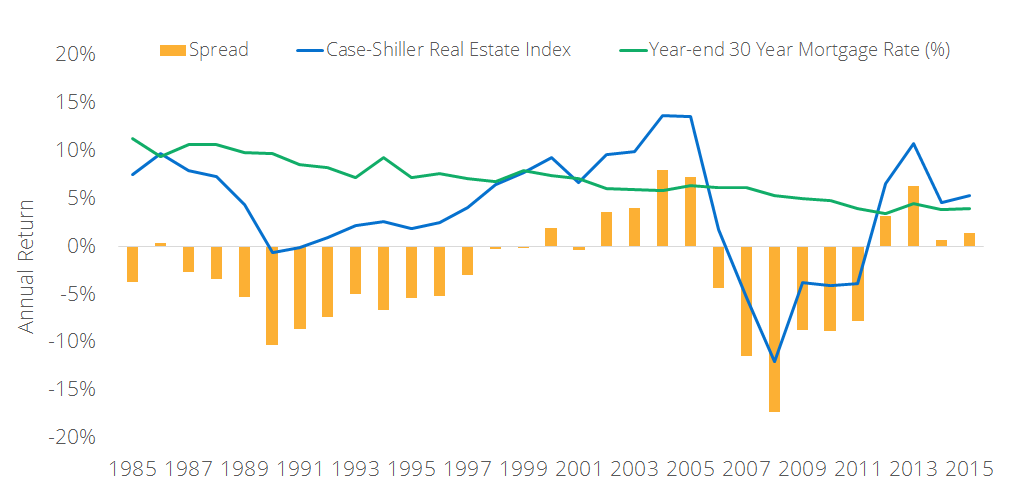
Clearly these figures are flawed – after all, home ownership is supposed to be a good investment, right? Interestingly, a review of the Case-Shiller index vis a vis mortgages rates over the last two decades will show that mortgage rates are often higher than the unlevered return on real estate.
Figure 1 – Spread of Cash-Shiller Real Estate Index against 30 Year Mortgage Rates, 1985-2015
The “Rent Savings” component of homeownership
The fix here is that the general cost of living cannot be avoided, and therefore this cash outflow should be excluded from the analysis. Said another way, if you did not own your home, you would be paying rent. Therefore, these savings on rent must be added to the cashflow to provide a better picture of the benefit of home ownership. The U.S. Bureau of Labor Statistics provides data for rent on primary residences[2]. By using this data to derive a rental yield, we can add this to the spread.Figure 2 – Rental yield added to Case-Shiller vs. 30 Year Mortgage Rates
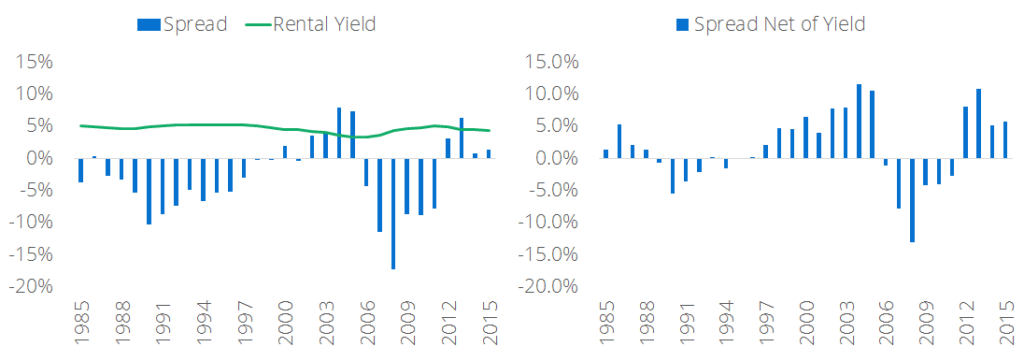
We will add an assumed “Rent Savings,” which we will estimate to equal 130% of the mortgage payment (principal and interest). The comparison of rent to mortgage will vary broadly by location and is a key component in various “rent vs. own” or “affordability” analyses out there. Trulia has a useful blog that explores how these can vary by location.
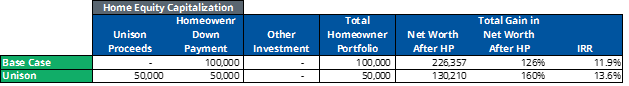
With this offset added to the cash flow model, the IRR in our Base Case increases to 11.9%, with net worth increasing from $100,000 to $226,357 after seven years.
Evaluating the use of Unison HomeBuyer
Let us now replicate the Base Case scenario but add the use of Unison HomeBuyer. Unison contributes 10% of proceeds on the purchase and is repaid the initial investment plus 35% of the change in value at the time of sale. We will call this the “Unison” scenario.For the moment, we will take the $50,000 in proceeds and set them aside. We will evaluate the impact of investing these proceeds, but first, let’s look at how the home ownership investment itself performs under either scenario.
In the base case, the 20% ownership provides exposure to 100% of the upside (5x leverage). With Unison HomeBuyer, 10% down payment provides exposure to 65% of the upside (6.5x leverage). Therefore, based on home value alone, the use of Unison will provide higher returns to the homeowner in times of positive appreciation. In times of negative appreciation, the investment will drop to zero more quickly.
The cash flows associated with the hold period are the same in both the Base Case and Unison scenarios. Given the lower initial investment, the IRR in the Unison scenario will be more sensitive to holding period cash flows. To rephrase, the Unison scenario is 1.3x more sensitive to HPA, and 2.0x more sensitive to holding period cash flows as compared to Base Case.
With the assumptions we’ve outlined for these two scenarios, the downward pressure from the holding period cash flows does not outweigh the benefit of the increased leverage on HPA. The IRR for the Unison Case is 13.6% compared to 11.9% for Base Case.
However, these resulting IRRs can shift around quite a bit with fluctuations in holding period cash flows, which can be modified by toggling certain variables (i.e., interest rate, income tax rate, property tax rate, insurance cost, maintenance cost, and implied rent).
Factoring in the Reinvested Proceeds
The holding period cash flows, for the purposes of this analysis, are just noise. The required IRR of the additional cash proceeds received from Unison (the “Reinvested Proceeds”) is irrespective of the movements of the IRRs that relate to holding period cash flow fluctuation.The return on the Reinvested Proceeds – and the resulting risk profile of the investment portfolio – is the key component of this analysis. We would like to address the question: instead of investing more money into my home, should I invest elsewhere? What benefit would this provide?
The concept of reinvestment risk is the key factor here. While investment in the home provides a higher return in the Unison scenario than in the Base Case, the fact is that only $50,000 is invested with Unison vs. $100,000 in the Base Case. The $50,000 of extra cash provided by Unison must be taken into consideration to compare the two scenarios.
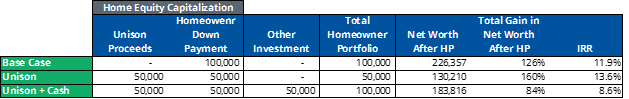
For instance, if the $50,000 in proceeds were not reinvested, but rather saved as cash in a low interest-bearing account (assume 1% annual interest), this “Unison + Cash” Case now has an IRR of 8.6% (vs. the 13.6% return on the home itself).
We can run the same exercise with different alternate investments. Assume that rather than cash the additional $50,000 is invested in equities at a 6.3% return, or bonds at a 2.6% return[3]. We can also assume that the $50,000 is invested in a “Mix” of all three options (50% stocks, 45% bonds, and 5% cash). The results are as follows:
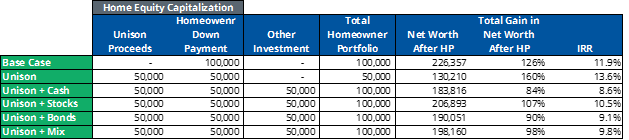
Figure 3- IRR dispersion across various scenarios
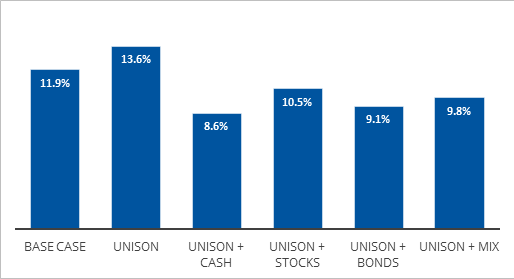
An individual focused solely on return would look at the above metrics and brush off the idea of using Unison given the difficulty of replicating the homeownership IRR in other asset classes. However, these charts ignore volatility of both the individual assets and the resulting portfolio.
Volatility and Sharpe Ratio considerations
Using historical data, we can observe that a home purchase with Unison can provide a similar return to that of a home purchase with the traditional 20% down structure, while providing reduced risk.Figure 4a – Annual historical return comparison for traditional 80/20 ownership vs. Unison[4]
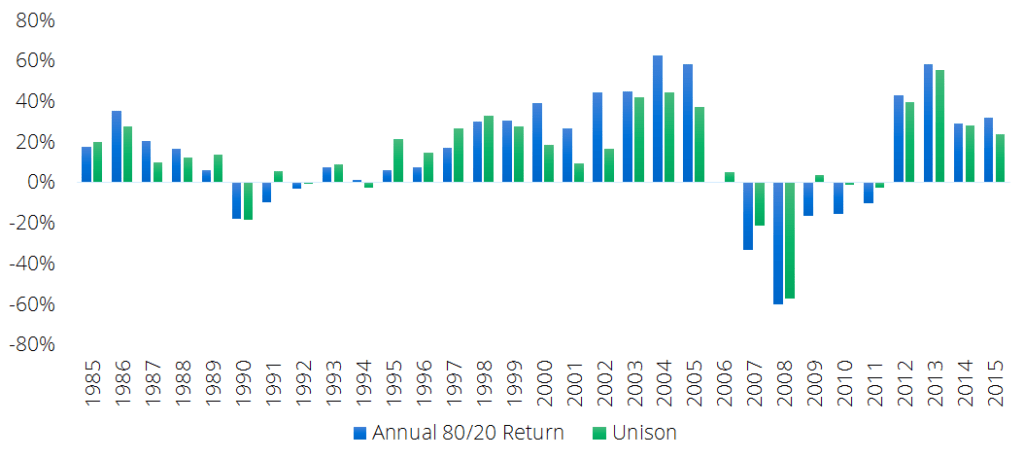
Figure 4b – Unison reduces risk for a similar return[5]
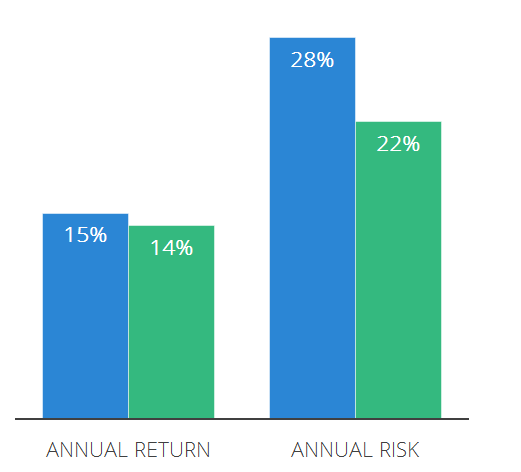
The graphs above have been produced using Case-Shiller data, which, as discussed, understates true volatility.
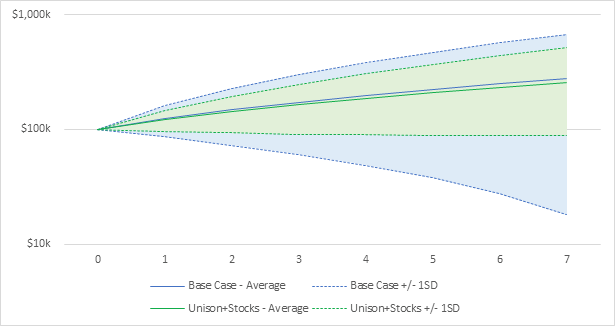
Going back to our Base Case and Unison+Stocks scenario, we can review how these assets perform over time with the inclusion of error bars based on the volatility. This time, we will use the volatility that Brodie derived in his blog post rather than the volatility implied by the Case Shiller. The cash flow projections (and corresponding paths that are plus or minus one standard deviation of the projection) are depicted in Figure 5.
Figure 5 – Expected growth of net worth over hold period[6]
The average annual return, standard deviation, and resulting Sharpe Ratio are presented below:
| Base Case | Unison + Stocks | |
|---|---|---|
| Average Return | 18% | 13% |
| Average STDev | 26% | 16% |
| Sharpe Ratio | 0.69 | 0.81 |
Conclusion
To conclude on this preliminary analysis, the results presented are not unexpected. Using Unison to diversify an investment portfolio will reduce risk and provide a higher Sharpe ratio. But, the return alone, albeit riskier, would be higher in a levered real estate asset vs stocks or bonds. The ability to obtain easy and cheap leverage for real estate drives this result. This then begs the question – what if the Reinvested Proceeds were put into a rental property? We also ignore less quantifiable benefits of the alternate investment options for the Reinvested Proceeds, such as the higher level of liquidity in case of a “rainy day.” We will analyze this further in the next edition of The Unison Solution.[1] The Sharpe Ratio is the industry standard measurement for calculating risk-adjusted return, developed by Nobel laureate William Sharpe. For more information, refer to this Morningstar article.
[2] https://fred.stlouisfed.org/series/CUUR0000SEHA
[3] Expected return based on BNY Melon 10-year Capital Market Return Assumptions for the Russell 3000 Index (equities) and Bloomberg Barclays U.S. Aggregate Index (fixed income).
[4] Annual 80/20 and Unison returns are hypothetical returns calculated using historical transaction data
[5] Annual risk is measured as the standard deviation of returns from 1985-2015.
[6] Graph is based on a logarithmic scale.
Contact UnisonIM
For more information, please contact:
Unison Investment Management
4 Embarcadero Center, Ste. 710, San Francisco, CA 94111
Real Estate Equity Exchange, Inc. Copyright 2023
or visit our Contact page


©2025 Unison Investment Management, LLC | 4 Embarcadero Center, Ste. 710, San Francisco, CA 94111 | 415-992-4200